 Skip to Content


Millstone Atmospheric Radiation Release
This is a page providing the public with a summary of releases of radiation to the atmosphere from Millstone Power Station in Waterford, Connecticut in accordance with the requirements of Connecticut Public Act No. 08-20.
The Act, signed into law in 2008 and effective October 1, 2008, amended Section 22a-135 of the Connecticut General Statutes. The law requires Millstone to post information concerning routine and continuous releases of radiation to the atmosphere, including dates, times and fissile material.
Sources of Radiation
Naturally occurring radioactivity has always been a part of our environment and comprises the majority of our exposure to radiation. Natural background radiation comes from three sources, cosmic radiation, terrestrial radiation and internal radiation. The majority of a person's annual radiation dose results from breathing radon, a gaseous product of natural uranium in rocks. Smaller doses also come from cosmic, terrestrial and internal (natural radioactivity in the foods we eat) sources.
- Percentage contributions of radiation from natural and man-made sources are shown in Figure 2. (Source: National Council on Radiation Protection and Measurements Report No. 160.)
In addition to background radiation, we are also exposed to radiation from a number of man-made sources. The single largest doses from man-made sources result from therapeutic and diagnostic applications of x-rays and radiopharmaceuticals. However, consumer products such as televisions, smoke detectors, combustible fuels and tobacco also contribute to human dose from man-made products. Much smaller doses result from weapons fallout and nuclear power plants.
- Figure 3 presents a comparison of typical radiation doses from various common U.S. activities and medical procedures. As doses from these radiation sources can vary greatly depending on the individual or circumstance, the values provided in the chart should be regarded as estimates.
Reporting Requirements
Atmospheric Release Report
All nuclear reactors produce radioactive products as part of their operation, the vast majority of which are contained within the fuel, fuel cladding and the reactor system. It is commonly known that it is essentially impossible to design a reactor that has zero radioactive emissions. This engineering fact is recognized by the U.S. Nuclear Regulatory Commission (NRC) and the U.S. Environmental Protection Agency (EPA) through the establishment of allowable limits for radioactivity released to the environment.
The allowable limits are set below levels at which any member of the public would be expected to receive a radiation dose that might produce adverse health effects. The hypothetical doses to members of the public from releases within these limits are a very small fraction of background radiation from natural and other man made sources.
As required by Public Act 08-20, the data reported here is a combination of actual and projected information. Any projected information that is reported on this website will be reviewed further before it is included in Millstone's annual Radiological Effluent Release Report (RERR). The RERR serves as the official document of record for radiological releases from Millstone.
- View Table 1, a schedule of Millstone Power Station's upcoming airborne batch effluent releases and the associated estimated activities.
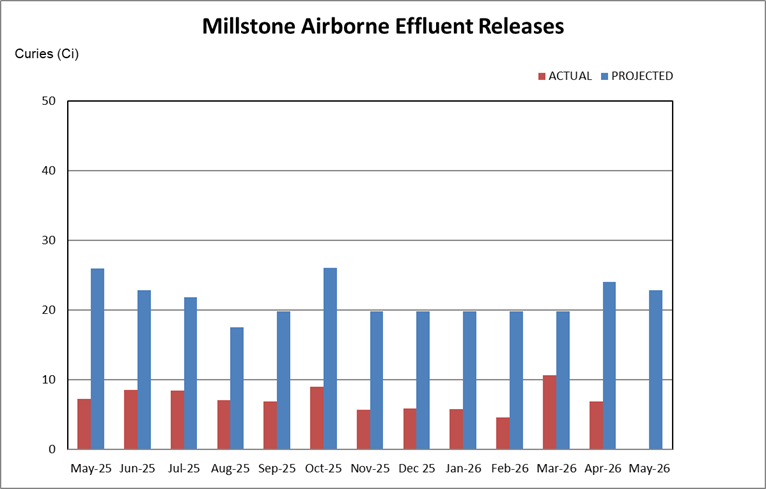
Millstone employees monitor and record radioactive airborne releases to ensure the plant is in compliance with federal limits, and to ensure that any potential impact on the environment is minimized. The total activities of actual and projected batch and continuous radioactive airborne releases from Millstone are provided in Figure 1.
Projections are reviewed and refined based on various input parameters such as changing plant conditions, station operating experience, and recent sample results.
Radiation Measurement and Station Operation Overview

In this photograph, a nuclear fuel assembly is being lowered into Millstone's reactor core. A curie is a widely used standard measure of radioactivity. The actual and projected monthly curies shown in the graph above take into consideration radioactive contributions from all four categories of airborne effluents from Millstone (fission and activation gases, particulates, iodine and tritium) that are released both continuously and in batches. The projected values are estimates based on previous experience and known scheduled activities.
During an outage, Millstone performs a scheduled shut down of one of its nuclear reactors for refueling and plant maintenance projects. Nuclear reactors require refueling on average about once every year and a half.
Airborne effluents discharged to the atmosphere are constantly monitored, sampled and analyzed to make sure radioactivity levels are below release limits. In addition, an environmental sampling program serves as a second, independent backup check system to verify the effectiveness of Millstone's effluent monitoring program.
Environmental samples regularly collected include air, soil, goat milk, pasture grass, hay, well water, broadleaf vegetation, fruits and vegetables. The details of this program are published in the station's Annual Radiological Environmental Operating Report.
Additional information regarding the operation and environmental impact of nuclear power plants is available from the Nuclear Energy Institute at www.nei.org.
Dose to the Public
There are two federal agencies charged with the responsibility of protecting the public from radiation and radioactivity, the U. S. Nuclear Regulatory Commission (NRC) and the U.S. Environmental Protection Agency (EPA). Both agencies have set regulatory dose limits for members of the public:
- NRC Limit - less than or equal to 100 mrem per year to the whole body
- EPA Limit - less than or equal to 25 mrem per year to the whole body
Radiation exposure (dose) calculations are performed routinely by Millstone personnel to assess any potential impact to the general public from Millstone's radioactive effluents. The purpose of these calculations is to ensure doses are being maintained as far below the federal dose limits as is reasonably achievable. Radiation doses are quantified by using radioactive effluent release data and calculations based on conservative NRC-recommended models.
The estimated radiological doses for last month to highest exposed member of the public due to gaseous radioactivity released from Millstone are provided in Table 2. The units mrad and mrem are commonly used to measure the biological effect of radiation energy deposited in tissue. Each dose is compared to regulatory limits.
Table 2:
Millstone Gaseous Radioactive Doses – April
| Dose Category 1 | Unit 2 | Limit 3 | Actual | % of Limit |
|---|---|---|---|---|
| Noble gas gamma | mrad | 0.833 | 0.0001406 | less than 0.0169 |
| Noble gas beta | mrad | 1.67 | 0.0001508 | less than 0.0090 |
| Iodine, particulates, tritium | mrem | 1.25 | 0.0088 | less than 0.700 |
| Total, whole body | mrem | 2.08 | 0.0049 | less than 0.235 |
Notes:
- 1 First three dose categories are NRC limits; the fourth is an EPA limit.
- 2 Units of mrad and mrem refer to radiation effects on tissue measured in energy per volume of tissue.
- 3 Limits are actually annual limits. Values in table are monthly fractions of the annual.
Due to conservative assumptions used in the calculation of doses, the dose actually received by any individual in the public are considerably lower.